Back to Browse
Free

Server data from the Official MCP Registry
MCP server for Dynatrace Managed to access logs, events, and metrics.
About
MCP server for Dynatrace Managed to access logs, events, and metrics.
Security Report
0.8
Use Caution0.8Critical RiskValid MCP server (2 strong, 3 medium validity signals). 12 known CVEs in dependencies (0 critical, 7 high severity) Package registry verified. Imported from the Official MCP Registry. Trust signals: trusted author (3/3 approved).
4 files analyzed · 13 issues found
Security scores are indicators to help you make informed decisions, not guarantees. Always review permissions before connecting any MCP server.
Unverified package source
We couldn't verify that the installable package matches the reviewed source code. Proceed with caution.
What You'll Need
Set these up before or after installing:
An escaped JSON array that defines the Dynatrace Managed environment(s) to connect to. See README file for contents of this.
Environment variable: DT_ENVIRONMENT_CONFIGS
Logging level (e.g. debug, info, warning, error)
Environment variable: LOG_LEVEL
Disable telemetry
Environment variable: DT_MCP_DISABLE_TELEMETRY
How to Install
Add this to your MCP configuration file:
{
  "mcpServers": {
    "io-github-dynatrace-oss-dynatrace-managed-mcp": {
      "env": {
        "LOG_LEVEL": "your-log-level-here",
        "DT_ENVIRONMENT_CONFIGS": "your-dt-environment-configs-here",
        "DT_MCP_DISABLE_TELEMETRY": "your-dt-mcp-disable-telemetry-here"
      },
      "args": [
        "-y",
        "@dynatrace-oss/dynatrace-managed-mcp-server"
      ],
      "command": "npx"
    }
  }
}Documentation
View on GitHubFrom the project's GitHub README.
Dynatrace Managed MCP Server
The local Dynatrace Managed MCP server allows AI Assistants to interact with one or more self-hosted Dynatrace Managed deployments, bringing observability data directly into your AI-assisted workflow.
This MCP server supports two modes:
- Local mode: Runs on your machine for development and testing.
- Remote mode: Connects over HTTP/SSE for distributed or production-like setups.
[!TIP] This MCP server is specifically designed for Dynatrace Managed (self-hosted) deployments. For Dynatrace SaaS environments, please use the Dynatrace MCP.
[!NOTE] This open source product is supported by the community. For feature requests, questions, or assistance, please use GitHub Issues.
Quickstart
You can add this MCP server to your AI Assistant, such as VSCode, Claude, Cursor, Kiro, Windsurf, ChatGPT, or Github Copilot. For more details, please refer to the configuration section below.
Configuration Methods
There are three ways to configure your Dynatrace Managed environments. Choose the method that works best for your use case:
Method 1: Configuration File (Recommended for Local Development)
The easiest way to configure multiple environments is by using a configuration file (JSON or YAML). This method supports:
- ✅ Clean, readable format - No quote escaping needed
- ✅ Comments (YAML only) - Document your configuration
- ✅ Environment variable interpolation - Keep tokens secure with
${VAR_NAME}syntax - ✅ Version control friendly - Commit config files without tokens
Example: dt-config.yaml
# Production environment
- dynatraceUrl: https://my-dashboard.company.com/
  apiEndpointUrl: https://my-api.company.com/
  environmentId: abc-123
  alias: production
  # Token is injected from an environment variable at runtime
  apiToken: ${DT_PROD_TOKEN}
  httpProxyUrl: http://proxy.company.com:8080

# Staging environment
- dynatraceUrl: https://staging-dashboard.company.com/
  apiEndpointUrl: https://staging-api.company.com/
  environmentId: xyz-789
  alias: staging
  apiToken: ${DT_STAGING_TOKEN}
Example: dt-config.json
[
  {
    "dynatraceUrl": "https://my-dashboard.company.com/",
    "apiEndpointUrl": "https://my-api.company.com/",
    "environmentId": "abc-123",
    "alias": "production",
    "apiToken": "${DT_PROD_TOKEN}",
    "httpProxyUrl": "http://proxy.company.com:8080"
  }
]
Usage in MCP configuration (e.g., claude_desktop_config.json):
Option A: Using npx (Recommended - no installation required)
{
  "mcpServers": {
    "dynatrace-managed": {
      "command": "npx",
      "args": ["-y", "@dynatrace-oss/dynatrace-managed-mcp-server@latest"],
      "env": {
        "DT_CONFIG_FILE": "./dt-config.yaml",
        "DT_PROD_TOKEN": "dt0c01.ABC123...",
        "DT_STAGING_TOKEN": "dt0c01.XYZ789...",
        "LOG_LEVEL": "info"
      }
    }
  }
}
Option B: Local development (requires cloning the repository)
{
  "mcpServers": {
    "dynatrace-managed": {
      "command": "node",
      "args": ["./dist/index.js"],
      "env": {
        "DT_CONFIG_FILE": "./dt-config.yaml",
        "DT_PROD_TOKEN": "dt0c01.ABC123...",
        "DT_STAGING_TOKEN": "dt0c01.XYZ789...",
        "LOG_LEVEL": "info"
      }
    }
  }
}
Note: Option B requires cloning this repository and running
npm install && npm run buildfirst.
Security Best Practice: Use environment variable interpolation (
${TOKEN_NAME}) in your config files so you can commit them to version control without exposing secrets!
See examples/dt-config.yaml and examples/dt-config.json for complete examples.
Method 2: Environment Variable (Docker/Kubernetes)
For Kubernetes deployments or if you prefer environment variables, you can set DT_ENVIRONMENT_CONFIGS with a JSON string:
DT_ENVIRONMENT_CONFIGS='[{"apiEndpointUrl":"https://api.example.com/","environmentId":"abc-123","alias":"production","apiToken":"dt0c01.ABC123"}]'
This method works well for:
- ✅ Kubernetes ConfigMaps/Secrets
- ✅ Docker containers
- ✅ CI/CD pipelines
- ⚠️ Not ideal for local development (quote escaping is cumbersome)
Method 3: .env File (Not Recommended)
While you can use a .env file, multiline values don't work reliably. Use Method 1 (config file) instead for cleaner local development.
Configuration Priority
If multiple configuration methods are set, the MCP server uses this priority:
DT_CONFIG_FILE- External file (highest priority)DT_ENVIRONMENT_CONFIGS- JSON string- Error - If neither is set
Configuration Fields
You need to configure the connection to your Dynatrace Managed environment(s). Each environment requires:
Configuration structure:
[
  {
    "dynatraceUrl": "https://my-dashboard-endpoint.com/",
    "apiEndpointUrl": "https://my-api-endpoint.com/",
    "environmentId": "my-env-id-1",
    "alias": "alias-env",
    "apiToken": "my-api-token",
    "httpProxyUrl": "",
    "httpsProxyUrl": ""
  }
]
Field descriptions:
dynatraceUrl: base URL for Dynatrace Managed dashboard, to which the environment ID will be appended (e.g.https://dmz123.dynatrace-managed.com). If not specified, will default to use the same value asDT_API_ENDPOINT_URL.apiEndpointUrl: base URL for Dynatrace Managed API, to which the environment ID will be appended (e.g.https://abc123.dynatrace-managed.com:9999)environmentId: ID of the managed environment, used for constructing URL for API and dashboards (e.g., of the form01234567-89ab-cdef-abcd-ef0123456789)alias: a friendly/human-readable name for the environmentapiToken: API token with required scopes (see Authentication)- (optional)
httpProxyUrl/httpsProxyUrl: URL of proxy server for requests (see Environment Variables)
Getting Started
If you are using multiple environments, we strongly recommend that you set up rules (see Rules) to guide your LLM in better understanding each environment.
Changes to the environment configuration will need an MCP server restart/reload. Changes won't be picked up until a fresh reload.
Once configured, you can start using example prompts like Get all details of the Dynatrace entity 'my-service' or What problems has Dynatrace identified? Give details of the first problem..
These queries use V2 REST APIs and incur no additional costs beyond your standard Managed license.
Minimum supported version: Dynatrace Managed 1.328.0
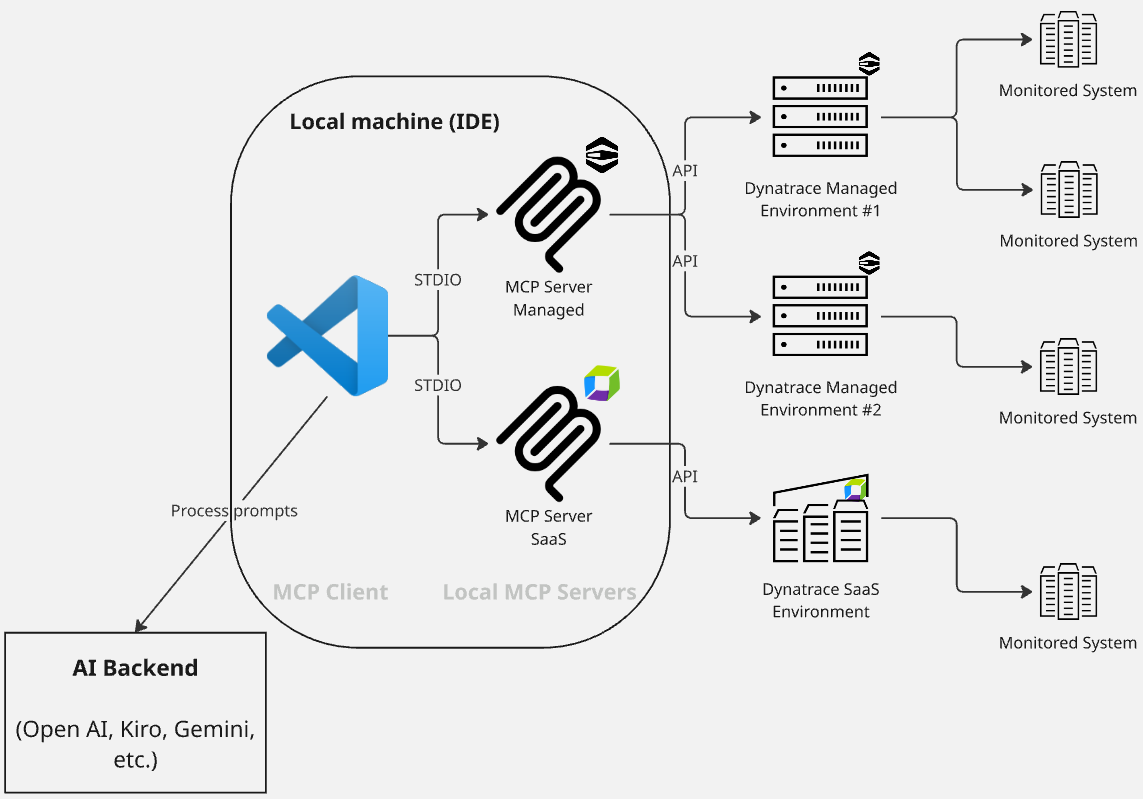
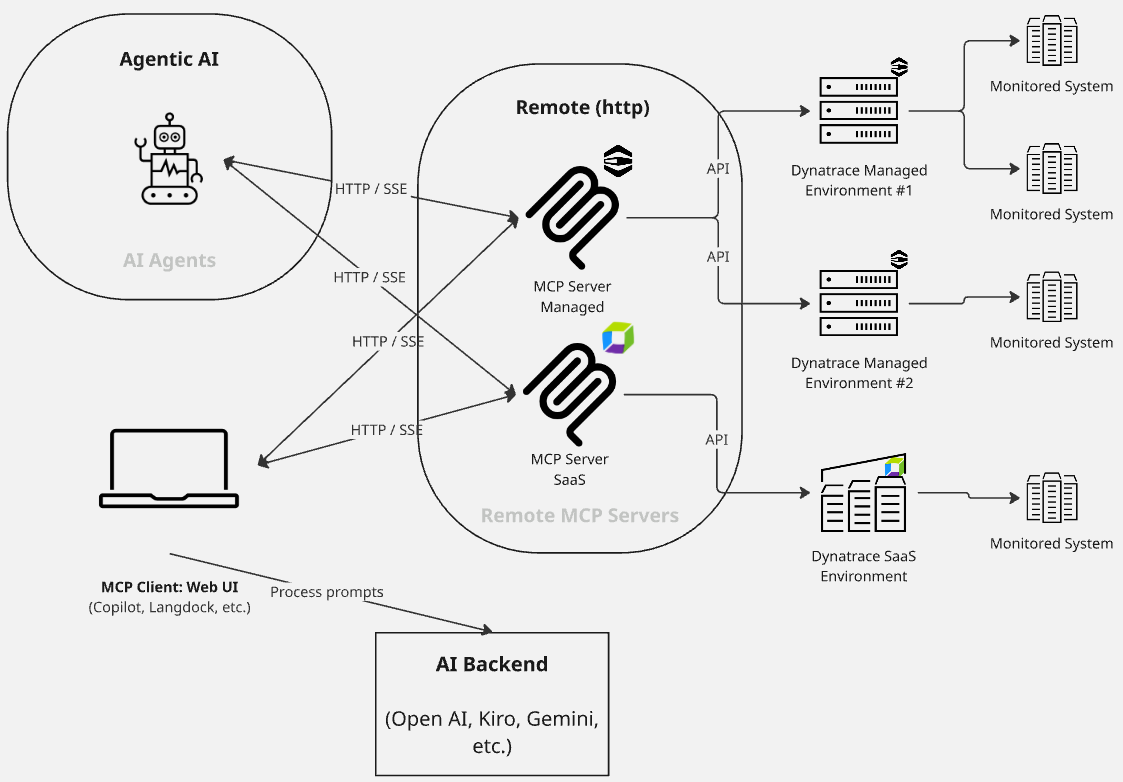
Architecture
Local mode
Remote mode
Use cases
There are two ways that Dynatrace Managed, and thus the MCP, may be used:
- Your Dynatrace Managed environment(s) is/are the primary Observability system, containing all live data; or
- There has been a migration from a Dynatrace Managed environment to a Dynatrace Saas environment; however, historical observability data has not been migrated and can still be accessed via a Dynatrace Managed environment. The Dynatrace Managed MCP is used to access historical data, and a separate Dynatrace SaaS MCP is used to access live and more recent data.
Specific use cases for the Dynatrace Managed MCP include:
- Real-time observability - Fetch production-level data for early detection and proactive monitoring
- Contextual debugging - Fix issues with full context from monitored exceptions, logs, and anomalies
- Security insights - Get detailed vulnerability analysis and security problem tracking. This can include multicloud compliance assessment with evidence-based investigation.
- Natural language queries - Queries are mapped to MCP tool usage, and thus API queries, with guidance for the next step
- Multiphase incident investigation - Systematic impact assessment and troubleshooting
- Multienvironment support - Query multiple Dynatrace Managed environments from the same MCP server
Capabilities
- Problems - List and get problem details from your services (for example Kubernetes)
- Security - List and get security problems / vulnerability details
- Entities - Get more information about a monitored entity, including relationship mappings
- SLO - List and get Service Level Objective details, including evaluation and error budgets
- Event Tracking - List and get system events
- Log Investigation - Search and filter logs with advanced content and time-based queries
- Metrics Analysis - Query and analyze performance metrics using V2 Metrics API
Performance Considerations
Important: This MCP server makes API calls to the Dynatrace Managed environment(s). It is designed for efficient usage (e.g., limiting the response sizes), but care should be taken not to overload the Dynatrace Managed environment(s) with large queries.
Best Practices:
- Use specific time ranges (e.g., 1-2 hours) rather than large historical queries.
- Use specific filters to limit the scope of queries as much as possible, for example, entity selectors that specify the entity ID.
- If using multiple environments, be specific about which one to query, where applicable. If querying multiple at once, be mindful of how much data will be returned to the LLM, e.g. top 10 problems from 2 envs = 20 problems, versus top 10 problems from 10 envs = 100 problems.
Configuration
You can add this MCP server (using STDIO or HTTP) to your AI Assistant.
We recommend always setting it up for your current workspace instead of using it globally.
VS Code
{
  "servers": {
    "npx-dynatrace-managed-mcp": {
      "command": "npx",
      "cwd": "${workspaceFolder}",
      "args": ["-y", "@dynatrace-oss/dynatrace-managed-mcp-server@latest"],
      "envFile": "${workspaceFolder}/.env"
    }
  }
}
Please note: In this config, the ${workspaceFolder} variable is used.
This only works if the config is stored in the current workspace, e.g., <your-repo>/.vscode/mcp.json. Alternatively, this can also be stored in user settings, and you can define env as follows:
{
  "servers": {
    "npx-dynatrace-managed-mcp": {
      "command": "npx",
      "args": ["-y", "@dynatrace-oss/dynatrace-managed-mcp-server@latest"],
      "env": {
        "DT_ENVIRONMENT_CONFIGS": "[{\"dynatraceUrl\":\"https://my-dashboard-endpoint.com/\",\"apiEndpointUrl\":\"https://my-api-endpoint.com/\",\"environmentId\":\"my-env-id-1\",\"alias\":\"alias-env\",\"apiToken\":\"my-api-token\"},{\"dynatraceUrl\":\"https://my-dashboard2-endpoint.com/\",\"apiEndpointUrl\":\"https://my-api2-endpoint.com/\",\"environmentId\":\"my-env-id-2\",\"alias\":\"alias-env-2\",\"apiToken\":\"my-api-token-2\"}]"
      }
    }
  }
}
Claude Desktop
{
  "mcpServers": {
    "dynatrace-managed-mcp": {
      "command": "npx",
      "args": ["-y", "@dynatrace-oss/dynatrace-managed-mcp-server@latest"],
      "env": {
        "DT_ENVIRONMENT_CONFIGS": "[{\"dynatraceUrl\":\"https://my-dashboard-endpoint.com/\",\"apiEndpointUrl\":\"https://my-api-endpoint.com/\",\"environmentId\":\"my-env-id-1\",\"alias\":\"alias-env\",\"apiToken\":\"my-api-token\"},{\"dynatraceUrl\":\"https://my-dashboard2-endpoint.com/\",\"apiEndpointUrl\":\"https://my-api2-endpoint.com/\",\"environmentId\":\"my-env-id-2\",\"alias\":\"alias-env-2\",\"apiToken\":\"my-api-token-2\"}]"
      }
    }
  }
}
Kiro
Amazon Kiro is an agentic IDE, and Kiro CLI provides an interactive chat experience directly in your terminal.
{
  "mcpServers": {
    "dynatrace-managed-mcp": {
      "command": "npx",
      "args": ["-y", "@dynatrace-oss/dynatrace-managed-mcp-server@latest"],
      "env": {
        "DT_ENVIRONMENT_CONFIGS": "[{\"dynatraceUrl\":\"https://my-dashboard-endpoint.com/\",\"apiEndpointUrl\":\"https://my-api-endpoint.com/\",\"environmentId\":\"my-env-id-1\",\"alias\":\"alias-env\",\"apiToken\":\"my-api-token\"},{\"dynatraceUrl\":\"https://my-dashboard2-endpoint.com/\",\"apiEndpointUrl\":\"https://my-api2-endpoint.com/\",\"environmentId\":\"my-env-id-2\",\"alias\":\"alias-env-2\",\"apiToken\":\"my-api-token-2\"}]"
      }
    }
  }
}
This configuration should be stored in <project-root>/.kiro/settings/mcp.json, or in user-level settings (~/.kiro/settings/mcp.json).
Google Gemini CLI
The Google Gemini CLI is Google's official command-line AI assistant that supports integration with MCP servers. You can add the Dynatrace MCP server using either the built-in management commands or manual configuration.
Using gemini CLI directly (recommended):
gemini extensions install https://github.com/dynatrace-oss/dynatrace-managed-mcp
export DT_ENVIRONMENT_CONFIGS="[{\"dynatraceUrl\":\"https://my-dashboard-endpoint.com/\",\"apiEndpointUrl\":\"https://my-api-endpoint.com/\",\"environmentId\":\"my-env-id-1\",\"alias\":\"alias-env\",\"apiToken\":\"my-api-token\"},{\"dynatraceUrl\":\"https://my-dashboard2-endpoint.com/\",\"apiEndpointUrl\":\"https://my-api2-endpoint.com/\",\"environmentId\":\"my-env-id-2\",\"alias\":\"alias-env-2\",\"apiToken\":\"my-api-token-2\"}]"
and verify that the server is running via
gemini mcp list
Or manually in your ~/.gemini/settings.json or .gemini/settings.json:
{
  "mcpServers": {
    "dynatrace-managed-mcp": {
      "command": "npx",
      "args": ["@dynatrace-oss/dynatrace-managed-mcp-server@latest"],
      "env": {
        "DT_ENVIRONMENT_CONFIGS": "[{\"dynatraceUrl\":\"https://my-dashboard-endpoint.com/\",\"apiEndpointUrl\":\"https://my-api-endpoint.com/\",\"environmentId\":\"my-env-id-1\",\"alias\":\"alias-env\",\"apiToken\":\"my-api-token\"},{\"dynatraceUrl\":\"https://my-dashboard2-endpoint.com/\",\"apiEndpointUrl\":\"https://my-api2-endpoint.com/\",\"environmentId\":\"my-env-id-2\",\"alias\":\"alias-env-2\",\"apiToken\":\"my-api-token-2\"}]"
      },
      "timeout": 30000,
      "trust": false
    }
  }
}
HTTP Server Mode (Alternative)
The default mode for this local MCP uses stdio for transport.
For scenarios where you need to run the MCP server as an HTTP service instead, you can use the HTTP server mode (e.g., for stateful sessions, load balancing, or integration with web clients):
Running as HTTP server:
# Get help and see all available options
npx -y @dynatrace-oss/dynatrace-managed-mcp-server@latest --help

# Run with HTTP server on default port 3000
npx -y @dynatrace-oss/dynatrace-managed-mcp-server@latest --http

# Run with custom port
npx -y @dynatrace-oss/dynatrace-managed-mcp-server@latest --http --port 3001

# Run with custom host/IP
npx -y @dynatrace-oss/dynatrace-mcp-server@latest --http --host 127.0.0.1   # recommended for local computers
npx -y @dynatrace-oss/dynatrace-mcp-server@latest --http --host 0.0.0.0     # recommended for container
npx -y @dynatrace-oss/dynatrace-mcp-server@latest --http --host 192.168.0.1 # recommended when sharing connection over a local network

# Check version
npx -y @dynatrace-oss/dynatrace-managed-mcp-server@latest --version
Configuration for MCP clients that support HTTP transport:
{
  "mcpServers": {
    "dynatrace-managed-mcp": {
      "url": "http://localhost:3000",
      "transport": "http"
    }
  }
}
Rule File
For efficient result retrieval from Dynatrace, please consider creating a rule file (e.g., .github/copilot-instructions.md, .amazonq/rules/), instructing coding agents on how to get more details for your component/app/service.
Here is an example for someone responsible for the easytrade system, who wants to focus on entities and problems related to easytrade.
Please adapt the names and filters to fit your use-cases, components, tagging strategy, deployment environment, etc.
Example Rule File:
# Dynatrace

We use Dynatrace Managed as our Observability solution. This document provides instructions for retrieving data for the EasyTrade system from Dynatrace using the Dynatrace Managed MCP.

## Best Practices

1. Always use specific time ranges, keeping these narrow (e.g. now-1h, now-24h), to avoid large data queries.
2. For entity selectors, consider using criteria for tags for more precise filtering (if the tagging strategy and naming are understood).

## Entity Selectors for easytrade

Consider using these criteria in the entitySelector to filter data for our easytrade application:

Services:

- `type(SERVICE),entityName.contains("easytrade")`
- `type(SERVICE),tag("app:easytrade")`

Process Groups & Containers:

- `type(PROCESS_GROUP),entityName.contains("easytrade")`
- `type(CONTAINER_GROUP_INSTANCE),entityName.contains("easytrade")`

Hosts:

- `type(HOST),tag("environment:production"),tag("app:easytrade")`

AWS Lambda Functions:

- `type(AWS_LAMBDA_FUNCTION),entityName.contains("easytrade")`
- `type(AWS_LAMBDA_FUNCTION),tag("AWS_REGION:us-west-2"),tag("app:easytrade")`
Environment Variables
Configuration Variables
-
DT_CONFIG_FILE(optional): Path to configuration file (JSON or YAML). Recommended for local development.- Supports relative paths (e.g.,
./dt-config.yaml) - Supports absolute paths (e.g.,
/etc/dynatrace/config.yaml) - Supports
~expansion (e.g.,~/dt-config.yaml) - Supports environment variable interpolation in file content (
${VAR_NAME}) - Example:
DT_CONFIG_FILE=./dt-config.yaml
- Supports relative paths (e.g.,
-
DT_ENVIRONMENT_CONFIGS(optional): JSON string with environment configurations. Useful for Kubernetes/Docker.- Used if
DT_CONFIG_FILEis not set - Must be a valid JSON array
- Example:
DT_ENVIRONMENT_CONFIGS='[{"apiEndpointUrl":"...","environmentId":"...","alias":"...","apiToken":"..."}]'
- Used if
Note: If both
DT_CONFIG_FILEandDT_ENVIRONMENT_CONFIGSare set,DT_CONFIG_FILEtakes priority.
Logging Variables
LOG_LEVEL(optional): Log verbosity level (e.g. debug, info, warn, error). Default:infoLOG_OUTPUT(optional): Log output destination. Default:filefile: Write logs to a file (default behavior)stdout/console: Write logs to standard output (⚠️ stdio transport only: stdio is reserved for MCP protocol - usestderr-allinstead)stderr: Write errors and warnings to standard error (info/debug suppressed)stderr-all: Write all log levels to standard error (✅ Recommended for VS Code with stdio transport)file+console/file+stdout: Write logs to both file and stdout (⚠️ stdio transport only: stdio is reserved for MCP protocol - usestderr-allinstead)file+stderr: Write logs to file and errors/warnings to stderrdisabled: Disable logging entirely
LOG_FILE(optional): Path to log file whenLOG_OUTPUTincludesfile. Default:dynatrace-managed-mcp.login current working directory
[!IMPORTANT] Choosing the right LOG_OUTPUT for your setup:
- stdio transport (default): Use
LOG_OUTPUT=stderr-allorLOG_OUTPUT=file(default)
- ❌
LOG_OUTPUT=consolewon't work - stdout is reserved for MCP protocol- ✅
LOG_OUTPUT=stderr-allshows all logs in VS Code's Output panel- ✅
LOG_OUTPUT=filewrites to log file (read withtail -f dynatrace-managed-mcp.log)- HTTP transport (
--httpmode): AnyLOG_OUTPUToption works
- ✅
LOG_OUTPUT=consolevisible in terminal- ✅
LOG_OUTPUT=stderr-allvisible in terminal- ✅
LOG_OUTPUT=filewrites to log file
Logging Examples:
# VS Code with stdio transport - see logs in Output panel
LOG_OUTPUT=stderr-all LOG_LEVEL=debug

# VS Code with stdio transport - write to file (default)
LOG_LEVEL=debug
# Read with: tail -f dynatrace-managed-mcp.log

# HTTP transport - log to console
LOG_OUTPUT=console LOG_LEVEL=debug node dist/index.js --http

# HTTP transport - log to file and console
LOG_OUTPUT=file+console LOG_LEVEL=debug node dist/index.js --http

# Log to custom file path
LOG_OUTPUT=file LOG_FILE=/var/log/dynatrace-mcp.log node dist/index.js

# Disable logging entirely (not recommended)
LOG_OUTPUT=disabled node dist/index.js
Rate Limiting Variables
DT_MCP_RATE_LIMIT_MAX_CALLS(optional): Maximum number of tool calls allowed within the rate limit window. Default:20DT_MCP_RATE_LIMIT_WINDOW_MS(optional): Rate limit window size in milliseconds. Default:20000(20 seconds)
Example: Allow 50 calls per 30 seconds:
DT_MCP_RATE_LIMIT_MAX_CALLS=50
DT_MCP_RATE_LIMIT_WINDOW_MS=30000
Multienvironment Config Fields
Inside the DT_ENVIRONMENT_CONFIGS variable, the elements of the array must contain all of these fields for each environment:
dynatraceUrl: base URL for Dynatrace Managed dashboard, to which the environment ID will be appended (e.g.https://dmz123.dynatrace-managed.com). If not specified, will default to use the same value asDT_API_ENDPOINT_URL.apiEndpointUrl(required): base URL for Dynatrace Managed API, to which the environment ID will be appended (e.g.https://abc123.dynatrace-managed.com:9999)environmentId(required): ID of the managed environment, used for constructing URL for API and dashboards (e.g. of the form01234567-89ab-cdef-abcd-ef0123456789)alias: a friendly/human-readable name for the environment, useful when distinguishing between environments with the LLMapiToken(required): API token with required scopes (see Authentication)httpProxyUrl(optional): HTTP Proxy for corporate environments, to route traffic through (e.g. http://proxy.company.com:8080)httpsProxyUrl(optional): HTTPS Proxy for corporate environments, to route traffic through (e.g. https://proxy.company.com:8080)
Proxy Configuration
The MCP server honors system proxy settings for corporate environments for each Dynatrace Managed environment you configure:
httpProxyUrl(optional, string, e.g.,http://proxy.company.com:8080) - Proxy server URL for HTTPS requests; orhttpsProxyUrl(optional, string, e.g.,http://proxy.company.com:8080) - Proxy server URL for HTTP requests
Example configuration with proxy:
export DT_ENVIRONMENT_CONFIGS='[
    {
        "dynatraceUrl": "https://my-dashboard-endpoint.com/",
        "apiEndpointUrl": "https://my-api-endpoint.com/",
        "environmentId": "my-env-id-1",
        "alias": "alias-env",
        "apiToken": "my-api-token",
        "httpProxyUrl": "http://proxy.company.com:8080"
    },
    {
        "dynatraceUrl": "https://my-dashboard2-endpoint.com/",
        "apiEndpointUrl": "https://my-api2-endpoint.com/",
        "environmentId": "my-env-id-2",
        "alias": "alias-env-2",
        "apiToken": "my-api-token-2",
        "httpProxyUrl": "http://proxy.company.com:8080"
    }
]'
Note that the httpProxyUrl/httpsProxyUrl variables are per-environment, so you can configure one environment to use a proxy whilst others may not need it.
Authentication
Dynatrace Managed uses API token-based authentication. Create an API token in your Managed cluster with the required scopes (see next subsection).
For more information about creating API tokens in Managed deployments, refer to the Dynatrace Managed documentation.
API Scopes for Managed Deployment
Your API token must include the following scopes for full functionality:
Required Scopes:
- Access problem and event feed, metrics, and topology (
DataExport) - Read audit logs (
auditLogs.read) - Read entities (
entities.read) - Read events (
events.read) - Read logs (
logs.read) - Read metrics (
metrics.read) - Read network zones (
networkZones.read) - Read problems (
problems.read) - Read security problems (
securityProblems.read) - Read SLO (
slo.read)
Note: API token scopes in Managed deployments differ from SaaS Platform tokens. Ensure you select the correct scopes for your Managed cluster version.
Key Differences from SaaS Dynatrace MCP
This MCP is for Dynatrace Managed platforms. There is a different Dynatrace MCP server for use with Dynatrace SaaS.
Key differences include:
- Dynatrace SaaS MCP uses DQL, whereas Dynatrace Managed uses the v2 APIs
- Dynatrace SaaS MCP uses Davis CoPilot, whereas Dynatrace Managed does not
- Dynatrace SaaS MCP uses OAuth, whereas Dynatrace Managed uses API Tokens
Hybrid Setup with both Dynatrace SaaS MCP and Dynatrace Managed MCP
This Managed Dynatrace MCP can be run alongside the SaaS Dynatrace MCP to enable a hybrid setup between your self-hosted and SaaS Dynatrace environments. This can be useful if you run your applications in a hybrid fashion, but it also supports migration scenarios where you have moved to Dynatrace SaaS but still have historical data on your Managed platform that you won't migrate. In this scenario, your MCP client can be configured to talk to both MCP servers simultaneously, enabling you to query across SaaS and Managed data.
To set this up, you should:
- Follow the instructions above to set up this Dynatrace Managed MCP server
- Follow the instructions for Dynatrace SaaS MCP to set it up, making sure to name the two servers differently in your MCP config file
- In your AI Assistant, confirm that it is connected to both
- (optional, but recommended) Set up rules or steering for your AI Assistant to give it clear guidance on using both MCPs
Once you have both MCP servers configured, you can ask questions that your MCP client should pass back to the right MCP Server (or to both, where appropriate).
Note that if you do not include rules or steering for your MCP client, queries such as Ask Dynatrace to list application problems from the last 24 hours might use one MCP server or both, depending on what is in your context window. If you choose to proceed this way, make sure that your commands are very specific, e.g. Ask Dynatrace to list application problems from the last 24 hours in my Managed environment.
Rules/Steering
AI Assistants usually support rule files to provide guidance on their use (see Rule File for configuration information).
If you are using this MCP server in a hybrid setup alongside the SaaS MCP server and/or you have multiple managed environments, it is recommended to add this to your configuration to prevent the AI Assistant from using the wrong MCP or getting confused.
Your steering rules will be unique to your setup, but some recommended templates are included below as a starting point. You can edit these as you see fit and include additional context that is specific to your environments.
Multiple Managed Environments
In this example, you have multiple Dynatrace Managed environments set up. This might be a development/test/production setup, or a set of entirely different applications. It is recommended to refer to your environments by the same alias you used in the DT_ENVIRONMENT_CONFIGS alias field to prevent confusion.
# Dynatrace

- I have three separate Dynatrace environments:
   1. "production" is a self-hosted Dynatrace Managed environment. It contains data about my production environment, and
      its issues and problems should outrank any other environment, as this is customer-facing.
      It is accessed via the Dynatrace Managed MCP, named
      dynatrace-managed-mcp-server.
   2. "test" is a self-hosted Dynatrace Managed environment. It contains data about my test environment, which is used to prepare code before going to Production.
      It is accessed via the Dynatrace Managed MCP, named dynatrace-managed-mcp-server.
   3. "development" is a self-hosted Dynatrace Managed environment. It contains data about my development environment,
      which is my lowest priority environment.
      It is accessed via the Dynatrace Managed MCP, named dynatrace-managed-mcp-server
- Be careful of which environment to use.
  If it is unclear, ask which environment to use.
- Must make it very clear to the user which environment data has come from.
Hybrid setup with migration date
In this example, you have migrated from Managed to SaaS, but still have historic data in your self-hosted Managed environment.
You want your AI Assistant to have context on what data lives where. This will enable it to know which environments to target for the date range you ask for, e.g. Show me all Dynatrace problems from the last 7 days may require data from both environments (and thus use both MCP servers), or may all reside in just the Dynatrace SaaS.
# Dynatrace

- I have two separate Dynatraces:
   1. Dynatrace Managed is self-hosted. It contains only historical data from before 29th November 2025.
      It is accessed via the Dynatrace Managed MCP, named dynatrace-managed-mcp-server
   2. Dynatrace SaaS is used for all live data.
      It is accessed through the Dynatrace SaaS MCP, named dynatrace-saas-mcp-server
- Be careful of which MCP to use.
  If it is unclear, ask which MCP to use.
- Must make it very clear to the user whether data has come from the Dynatrace Managed or Dynatrace SaaS.
Hybrid setup running in tandem
In this example, you use Dynatrace Managed for some of your applications and Dynatrace SaaS for others, and want your MCP client to have context on where to find data for each one.
# Dynatrace

- I have two separate Dynatraces, which both contain live data:
   1. Dynatrace Managed is self-hosted. It only contains observability data for some of my systems,
      primarily the bookstore systems.
      It is accessed via the Dynatrace Managed MCP, named dynatrace-managed-mcp-server
   2. Dynatrace SaaS is used for observability of all my other systems.
      It is accessed through the Dynatrace SaaS MCP, named dynatrace-saas-mcp-server
- Be careful of which MCP to use.
  If it is unclear, ask which MCP to use.
- Must make it very clear to the user whether data has come from the Dynatrace Managed or Dynatrace SaaS.
Example prompts
You can start with something as simple as "Ask Dynatrace to list problems", and follow up with more sophisticated examples.
Troubleshooting
Authentication Issues
In most cases, authentication issues stem from missing scopes or invalid tokens. Please ensure that you have added all required scopes as listed above.
When experiencing errors, you can ask the AI Assistant for the exact error returned by the MCP. For startup issues, check the AI Assistant logs.
You can also try running the MCP directly to see if it reports errors on startup:
```bash
npx @dynatrace-oss/dynatrace-managed-mcp-server@latest
```
Telemetry
The Dynatrace MCP Server includes sending Telemetry Data via Dynatrace OpenKit to help improve the product. This includes:
- Server start events
- Tool usage (which tools are called, success/failure, execution duration)
- Error tracking for debugging and improvement
Privacy and Opt-out:
- Telemetry is enabled by default but can be disabled by setting
DT_MCP_DISABLE_TELEMETRY=true - No sensitive data from your Dynatrace environment is tracked
- Only anonymous usage statistics and error information are collected
- Usage statistics and error data is transmitted to Dynatrace’s analytics endpoint
Configuration options:
DT_MCP_DISABLE_TELEMETRY(boolean, default:false) - Disable TelemetryDT_MCP_TELEMETRY_APPLICATION_ID(string, default:dynatrace-managed-mcp) - Application ID for trackingDT_MCP_TELEMETRY_ENDPOINT_URL(string, default: Dynatrace endpoint) - OpenKit endpoint URLDT_MCP_TELEMETRY_DEVICE_ID(string, default: auto-generated) - Device identifier for tracking
To disable usage tracking, add this to your configuration:
DT_MCP_DISABLE_TELEMETRY=true
Reviews
No reviews yet
Be the first to review this server!
More Developer Tools MCP Servers
Git
Freeby Modelcontextprotocol · Developer Tools
Read, search, and manipulate Git repositories programmatically
80.0K
Stars
3
Installs
6.5
Security
No ratings yet
Local
Toleno
Freeby Toleno · Developer Tools
Toleno Network MCP Server — Manage your Toleno mining account with Claude AI using natural language.
114
Stars
404
Installs
8.0
Security
4.8
Local
mcp-creator-python
Freeby mcp-marketplace · Developer Tools
Create, build, and publish Python MCP servers to PyPI — conversationally.
-
Stars
55
Installs
10.0
Security
5.0
Local
MarkItDown
Freeby Microsoft · Content & Media
Convert files (PDF, Word, Excel, images, audio) to Markdown for LLM consumption
89.9K
Stars
15
Installs
6.0
Security
5.0
Local
mcp-creator-typescript
Freeby mcp-marketplace · Developer Tools
Scaffold, build, and publish TypeScript MCP servers to npm — conversationally
-
Stars
14
Installs
10.0
Security
5.0
Local
FinAgent
Freeby mcp-marketplace · Finance
Free stock data and market news for any MCP-compatible AI assistant.
-
Stars
13
Installs
10.0
Security
No ratings yet
Local