Back to Browse
Free

Server data from the Official MCP Registry
MCP server for air-Q Cloud API — access air quality data from anywhere
About
MCP server for air-Q Cloud API — access air quality data from anywhere
Security Report
8.7
Low Risk8.7Low RiskValid MCP server (1 strong, 2 medium validity signals). 5 known CVEs in dependencies Package registry verified. Imported from the Official MCP Registry.
4 files analyzed · 6 issues found
Security scores are indicators to help you make informed decisions, not guarantees. Always review permissions before connecting any MCP server.
Permissions Required
This plugin requests these system permissions. Most are normal for its category.
What You'll Need
Set these up before or after installing:
Path to the air-Q Cloud device configuration JSON file
Environment variable: AIRQ_CLOUD_CONFIG_FILE
Inline JSON array with configured air-Q Cloud devicesRequired
Environment variable: AIRQ_CLOUD_DEVICES
Global fallback API key (used when per-device api_key is omitted)Required
Environment variable: AIRQ_CLOUD_API_KEY
How to Install
Add this to your MCP configuration file:
{
  "mcpServers": {
    "io-github-corantgmbh-mcp-airq-cloud": {
      "env": {
        "AIRQ_CLOUD_API_KEY": "your-airq-cloud-api-key-here",
        "AIRQ_CLOUD_DEVICES": "your-airq-cloud-devices-here",
        "AIRQ_CLOUD_CONFIG_FILE": "your-airq-cloud-config-file-here"
      },
      "args": [
        "mcp-airq-cloud"
      ],
      "command": "uvx"
    }
  }
}Documentation
View on GitHubFrom the project's GitHub README.
mcp-airq-cloud


![]()
![]()
MCP server for the air-Q Cloud API — access air quality data from anywhere.
Unlike mcp-airq (which communicates directly with devices on the local network), this server uses the air-Q Cloud REST API to retrieve sensor data remotely.
The same mcp-airq-cloud executable also works as a direct CLI when you pass a
tool name as a subcommand.
Tools
| Tool | Description |
|---|---|
list_devices | List configured air-Q Cloud devices |
get_air_quality | Get latest sensor readings (supports device/location/group selection) |
get_air_quality_history | Get historical data within a time range as column-oriented JSON |
plot_air_quality_history | Render one historical chart per sensor across all matching devices |
export_air_quality_history | Export one historical sensor as one csv or xlsx across matching devices |
All tools are read-only — the Cloud API does not support device configuration or control.
Installation
pip install mcp-airq-cloud
Or install from source:
git clone https://github.com/CorantGmbH/mcp-airq-cloud.git
cd mcp-airq-cloud
uv sync --frozen --extra dev
CLI Usage
Use the same command directly from the shell:
mcp-airq-cloud list-devices
mcp-airq-cloud get-air-quality --device "Living Room"
mcp-airq-cloud get-air-quality-history --device "Living Room" --last-hours 24 --sensors co2 pm2_5
mcp-airq-cloud plot-air-quality-history --sensor co2 --output-format png --output co2.png
mcp-airq-cloud export-air-quality-history --sensor co2 --output-format xlsx --output co2.xlsx
For historical plots and exports:
- omit
device,location, andgroupto combine all configured devices into one artifact - use
locationorgroupto combine only the matching devices plot_air_quality_historyreturns one file per requested sensor, with one series per matching deviceexport_air_quality_historyreturns one CSV/XLSX file per request, with rows for all matching devices
The CLI subcommands mirror the MCP tool names. Both styles work:
mcp-airq-cloud list-devices
mcp-airq-cloud list_devices
To force MCP server mode from an interactive terminal, run:
mcp-airq-cloud serve
The CLI is pipe-friendly: successful command output goes to stdout, while
tool errors go to stderr with exit code 1. Plot commands can also stream
directly to stdout.
mcp-airq-cloud get-air-quality --device "Living Room" | jq '.co2'
mcp-airq-cloud get-air-quality-history --device "Living Room" --compact-json | jq '.columns.co2'
mcp-airq-cloud get-air-quality-history --device "Living Room" --yaml | yq '.columns.co2'
mcp-airq-cloud plot-air-quality-history --sensor co2 --device "Living Room" --output - > co2.png
mcp-airq-cloud export-air-quality-history --sensor co2 --device "Living Room" --output - > co2.xlsx
Historical Data
Three tools provide access to historical sensor data via the air-Q Cloud API:
Plotting charts
plot_air_quality_history renders a chart for one sensor. When multiple devices
match, each device becomes a separate series in the same chart.
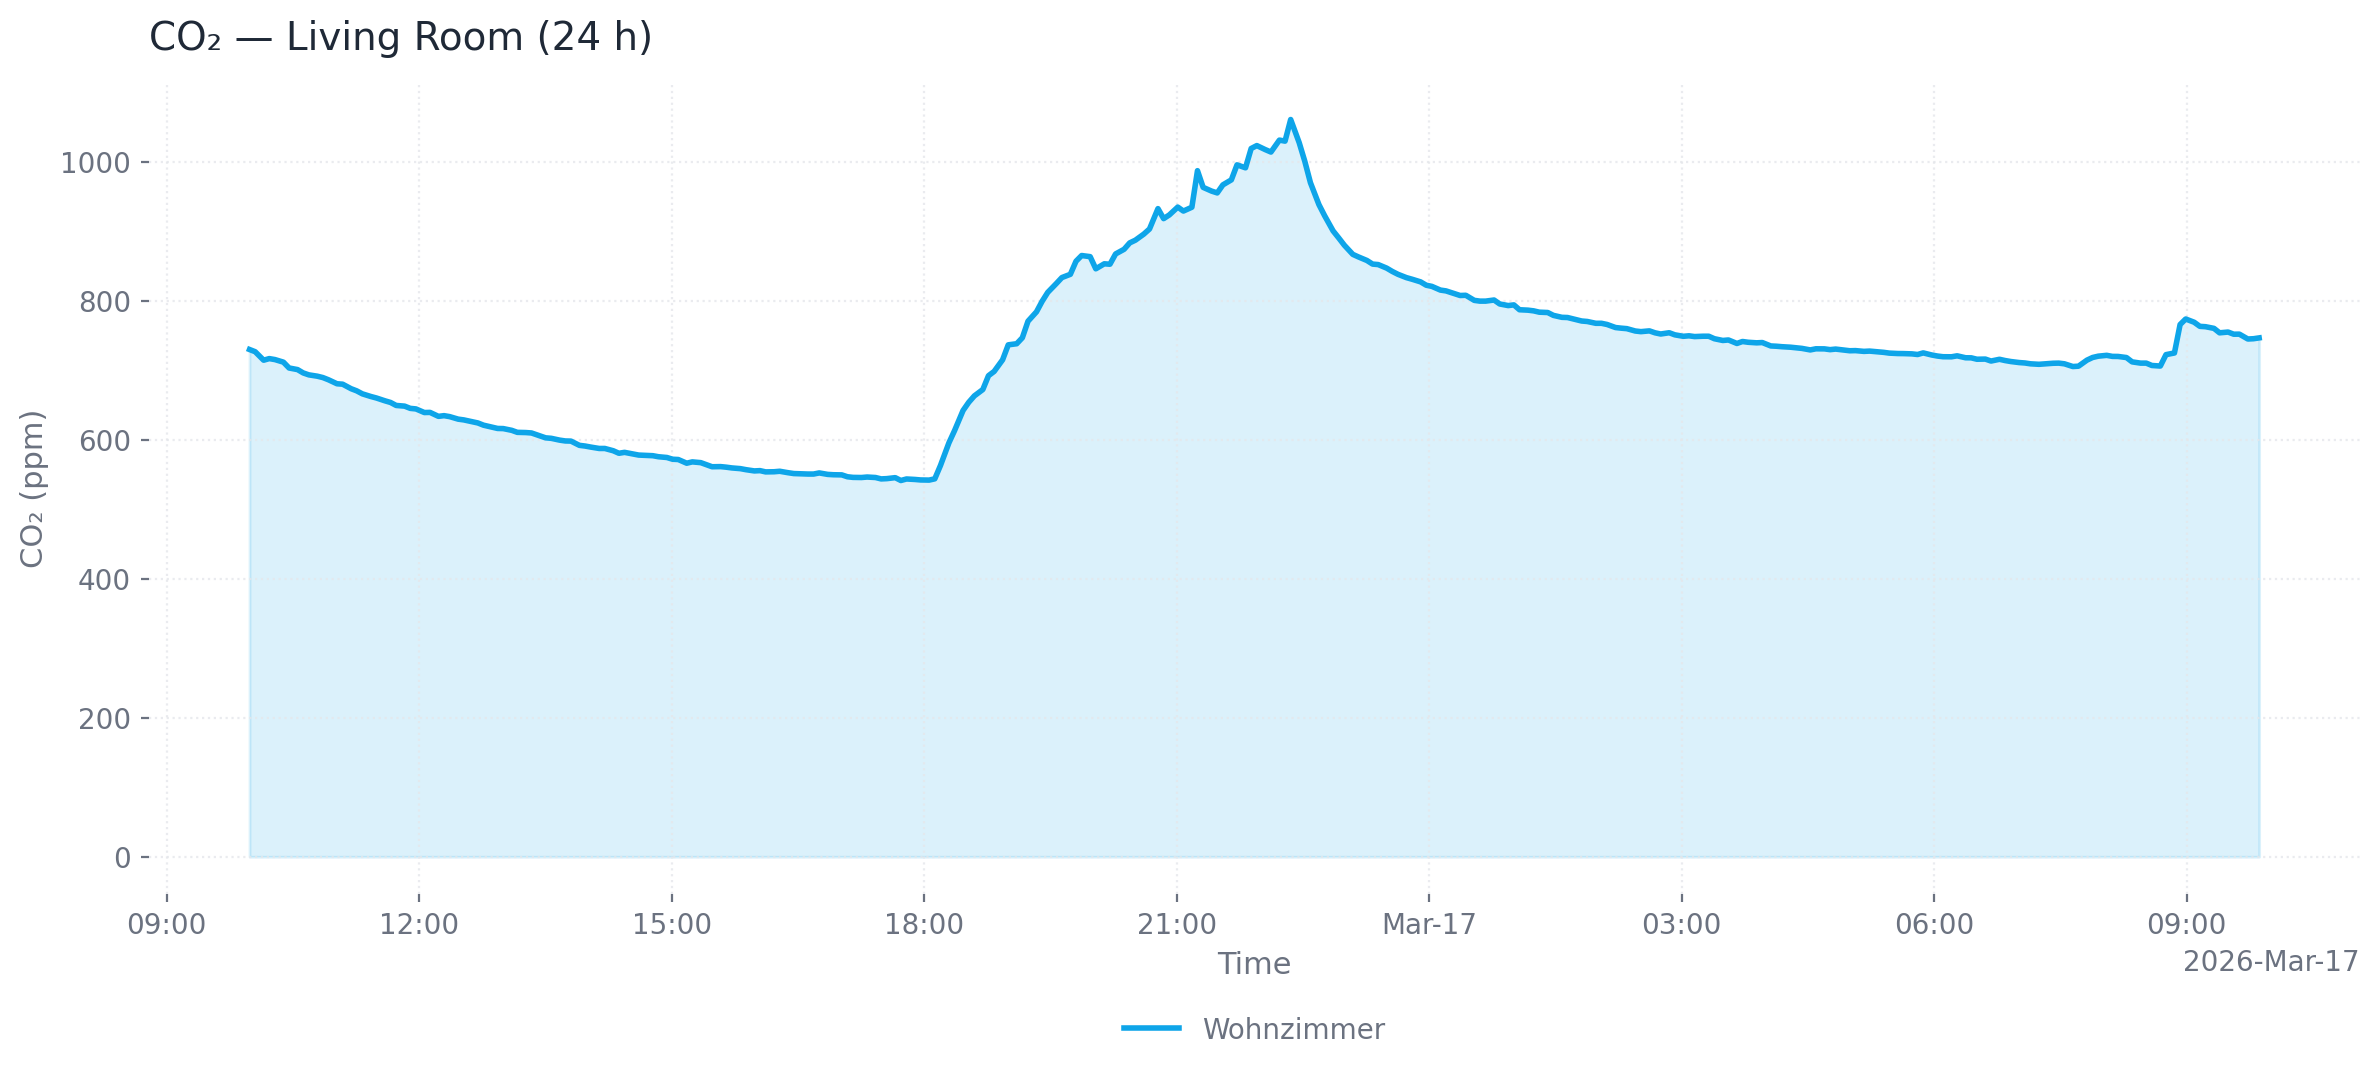
Single device (24 h, area chart, PNG)
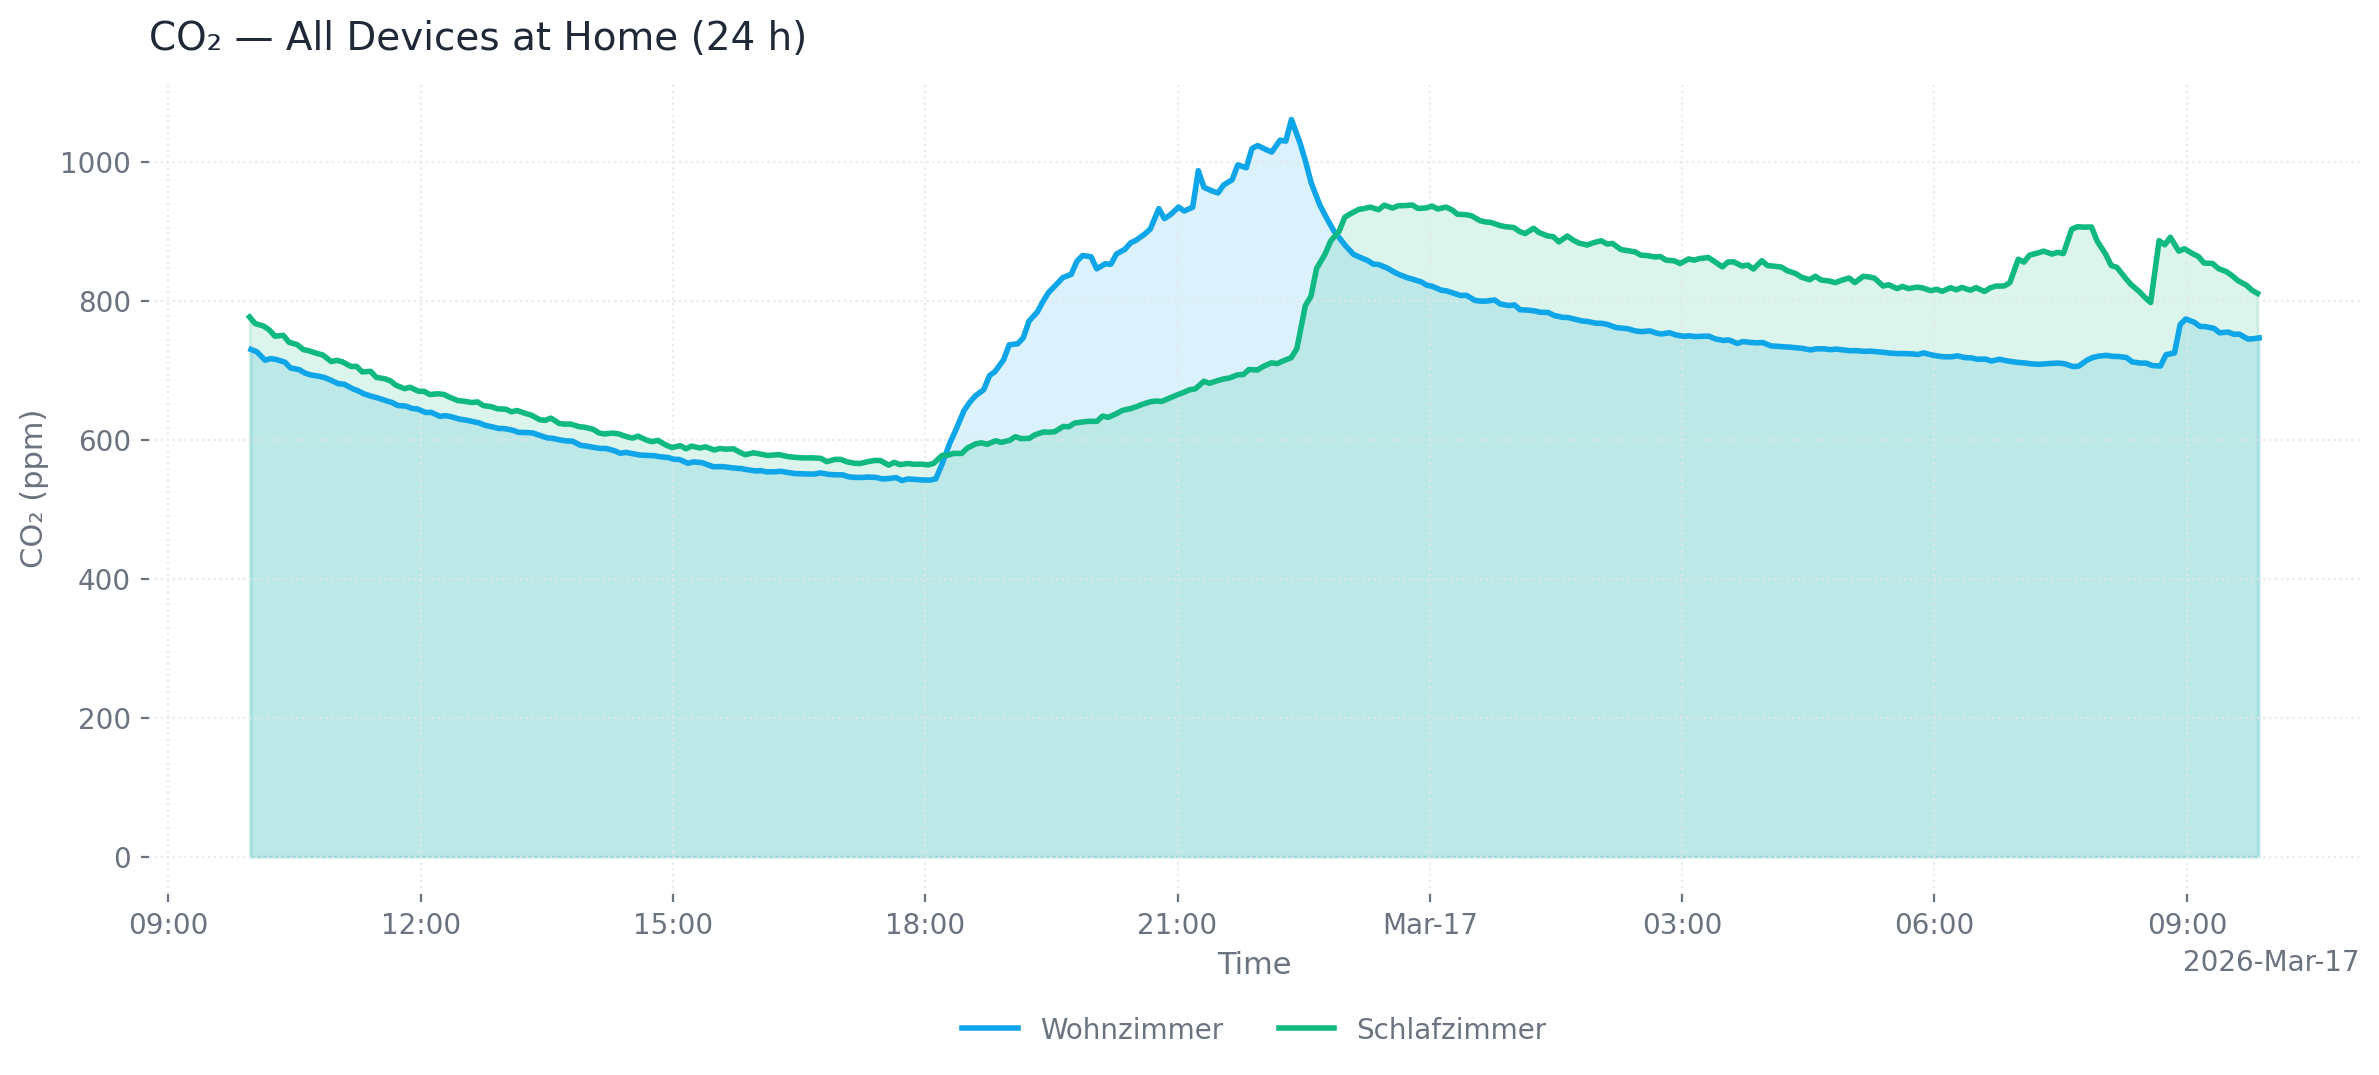
Multiple devices at one location (24 h, area chart, PNG)
# Single device, last 24 hours (default), PNG output (default)
mcp-airq-cloud plot-air-quality-history --sensor co2 --device "Living Room"

# All devices at a location, custom time range, SVG output
mcp-airq-cloud plot-air-quality-history --sensor co2 --location "Living Room" \
  --from-datetime "2026-03-16T00:00:00" --to-datetime "2026-03-17T00:00:00" \
  --output-format svg --output co2.svg

# All configured devices, dark mode, line chart
mcp-airq-cloud plot-air-quality-history --sensor co2 --dark --chart-type line

# Save to file
mcp-airq-cloud plot-air-quality-history --sensor co2 --output co2_chart.png
Output formats: png (default), webp, svg, html (interactive Plotly chart with hover tooltips and zoom)
Customization: --title, --x-axis-title, --y-axis-title, --chart-type (line/area), --dark, --timezone-name
Exporting data
export_air_quality_history produces one CSV or Excel file containing all matching devices.
# CSV export (default)
mcp-airq-cloud export-air-quality-history --sensor co2 --device "Living Room" --last-hours 48

# Excel export for all devices at a location
mcp-airq-cloud export-air-quality-history --sensor co2 --location "Home" \
  --output-format xlsx --output co2.xlsx
Common parameters
| Parameter | Default | Description |
|---|---|---|
--last-hours | 1 (history) / 24 (plot) | Hours of data to retrieve |
--from-datetime / --to-datetime | — | ISO 8601 time range (overrides --last-hours) |
--max-points | 300 | Downsample to at most N evenly spaced points |
--timezone-name | UTC | IANA timezone for timestamps (e.g. Europe/Berlin) |
Configuration
You need a Cloud API key and the 32-character device ID for each device. Both can be obtained at my.air-q.com.
Option 1: Environment variable (inline JSON)
export AIRQ_CLOUD_DEVICES='[{"id": "de45d2ed777780c96c0deae7a220b745", "api_key": "your-api-key", "name": "Living Room"}]'
Option 2: Default config file (recommended)
Place a JSON file at ~/.config/airq-cloud-devices.json — no environment variable needed:
[
  {"id": "de45d2ed777780c96c0deae7a220b745", "api_key": "your-api-key", "name": "Living Room"}
]
Option 3: Custom config file path
export AIRQ_CLOUD_CONFIG_FILE=/path/to/devices.json
Option 4: Global API key
If all devices share the same API key, set it once:
export AIRQ_CLOUD_API_KEY="your-api-key"
export AIRQ_CLOUD_DEVICES='[{"id": "de45d2ed777780c96c0deae7a220b745", "name": "Living Room"}]'
Device config fields
| Field | Required | Description |
|---|---|---|
id | yes | 32-character cloud device ID |
api_key | no | Per-device API key (falls back to AIRQ_CLOUD_API_KEY) |
name | no | Friendly name (defaults to first 8 chars of ID) |
location | no | Location for grouping (e.g. "Wohnzimmer") |
group | no | Group for grouping (e.g. "zu Hause") |
Usage with Claude Desktop
Add to claude_desktop_config.json:
{
  "mcpServers": {
    "air-Q Cloud": {
      "command": "mcp-airq-cloud",
      "env": {
        "AIRQ_CLOUD_DEVICES": "[{\"id\": \"<device-id>\", \"api_key\": \"<key>\", \"name\": \"Living Room\"}]"
      }
    }
  }
}
Usage with Claude Code
claude mcp add air-Q-Cloud mcp-airq-cloud \
  -e AIRQ_CLOUD_DEVICES='[{"id":"<ID>","api_key":"<KEY>","name":"<Name>"}]'
Development
uv sync --frozen --extra dev
uv run pre-commit install
uv run pytest
The repository uses a project-local .venv plus uv.lock for reproducible
tooling. Run developer commands through uv run, for example:
uv run ruff check .
uv run ruff format --check .
uv run pyright
uv run pre-commit run --all-files
License
Apache 2.0 — see LICENSE.
Reviews
No reviews yet
Be the first to review this server!
More Developer Tools MCP Servers
Fetch
Freeby Modelcontextprotocol · Developer Tools
Web content fetching and conversion for efficient LLM usage
80.0K
Stars
4
Installs
5.3
Security
No ratings yet
Local
Toleno
Freeby Toleno · Developer Tools
Toleno Network MCP Server — Manage your Toleno mining account with Claude AI using natural language.
137
Stars
517
Installs
8.0
Security
4.8
Local
mcp-creator-python
Freeby mcp-marketplace · Developer Tools
Create, build, and publish Python MCP servers to PyPI — conversationally.
-
Stars
72
Installs
10.0
Security
4.6
Local